The data in this graph reflects data from top 35 shipowning countries in 2017 (according UNCTAD secretariat calculations) as they represent 88% in terms of…

The future is unknown for us, however sometime development trends can be clearly seen. In this case autonomous ships timeline shows development path of autonomous…
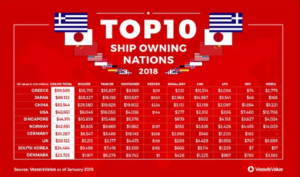
Updated figures regarding data from 2019 and 2020 can be found here: Fleet Value for Top 10 Shipowning Countries (2020) VesselsValue recently in january of…

Equasis world merchant fleet statistics report provides a picture of the world’s merchant fleet derived from data contained in the Equasis database. By using functionality…

Here is infographic reflecting growth of container vessels. Infographic republished from https://maritimecyprus.com.

Few months ago I saw on net infographic showing Top 10 Shipowning Nations by Value. Data were presented in table therefore I took them and…

Simple data visualization showing Top 10 maritime nations! You can choose between number of vessels, gross tonnage or value in USD. Data…