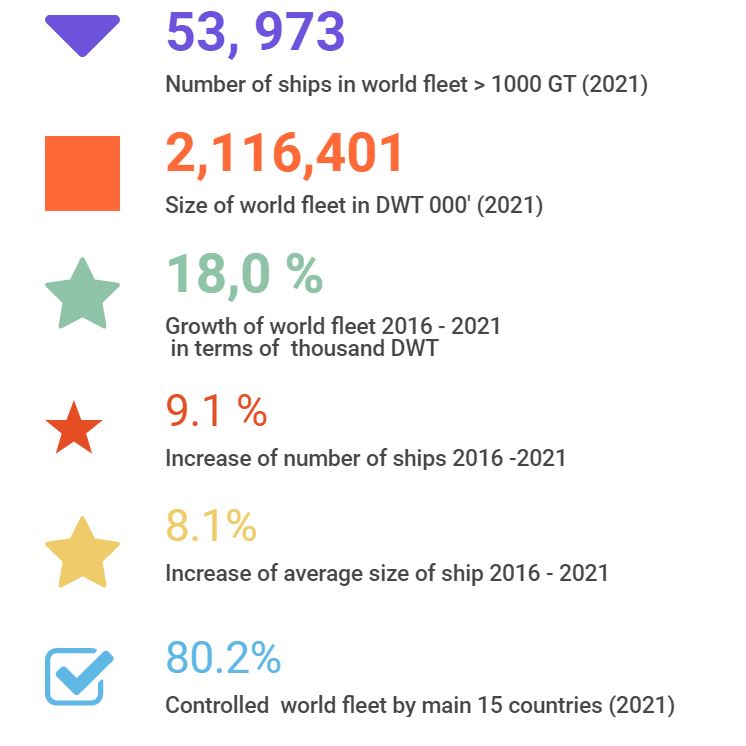
Comparing world merchant fleet data from 2021 with data from 2016 (5 year period) – top 3 shipowning countries have remained the same: Greece, Japan and China. In total the world merchant fleet accounted for 2 116 401 ( DWT ‘000) and 53 973 in terms of number of ships over 1000 GT. All data are taken from UnctadStatistics and visualized by using Infogram.
*The data in this post are updated taking into account UNCTAD statistics data from 2021.
| World fleet data | 2016 | 2017 | 2018 | 2019 | 2020 | 2021 |
| 000′ DWT | 1,794,029 | 1,850,606 | 1,920,052 | 1,972,007 | 2,053,514 | 2,116,401 |
| Growth rate DWT | 3.37% | 3.15% | 3.75% | 2.71% | 4.13% | 3.06% |
| Number of Ships | 49,445 | 50,090 | 51,480 | 52,417 | 53,275 | 53,973 |
| Growth rate number of ships | 2.03% | 1.30% | 2.78% | 1.82% | 1.64% | 1.31% |
| Average ship’s size | 36,283 | 36,946 | 37,297 | 37,622 | 38,546 | 39,212 |
| Growth rate avg size of ship | 1.31% | 1.83% | 0.95% | 0.87% | 2.46% | 1.73% |
| Controlled fleet by top 15 nations | 80.79% | 79.64% | 81.11% | 81.30% | 81.22% | 80.77% |
In 2021 top 15 countries by controlled DWT was : Greece, China, Japan, Singapore ,China – Hong Kong SAR, Germany, Republic of Korea, Norway, United States of America, Bermuda, France, Taiwan (province of China), United Kingdom, Denmark and Belgium.
Infographic
This infographic visualizes data regarding top 15 shipowning countries regarding growth of controlled DWT, changes in share of world fleet, increase of number of owned ships and changes in average size of vessel. Data comes from UNCTAD statistics http://stats.unctad.org/fleetownership and are visualized by use of Infogram.
Other visualisations can be found here: http://infomaritime.eu/index.php/category/maritime-data/
Very nice indeed. Can you please send me the same by email.