The Co2 emissions in 2020 were 119,3 M [m tonnes] in Eu from ships > 5000 GT according to data from the MRV database hosted by EMSA. The Co2 emissions from ships are mainly linked with two factors intensity of shipping and ships’ type! Therefore there is a decrease s by 18,7 % (27,4 M [m tonnes] ) comparing the total amount of emissions in 2020 with figures from 2019. This decrease is linked with the impact of COVID-19 on shipping intensity in the EU and not with an improvement of the environmental performance of the shipping industry.
EMSA launched the MRV database in 2017 and the European Maritime Transport Environmental Report (EMTER) for the first time was released in September 2021 (Report can be found here). However, data in this report covered only data from 2018 thus not giving a possibility to get insight into data for the latest years. The slides made by the Infomaritime team attached to this post give a possibility to follow data from the MRV database regarding 2020, 2019 and 2018.
MRV database is a great source as it is public and it provides freely accessible data regarding emissions from ships, linked with ship’s type, technical efficiency, and other different aspects. However, the next challenge is to make those data visible to policymakers, researchers, journalists, decision-makers, and others.
Infomaritime’s project
At Infomaritime we are working on a Google Data Studio dashboard project which will allow getting insights into data regarding Co2 emissions from ships in the EU. The first results, before publishing the whole Google dashboard project, already are put into graphs reflecting data from 2018, 2019, 2020 and we have made Google Slides, which are freely accessible for anyone. But some aspects are clear and comparable already:
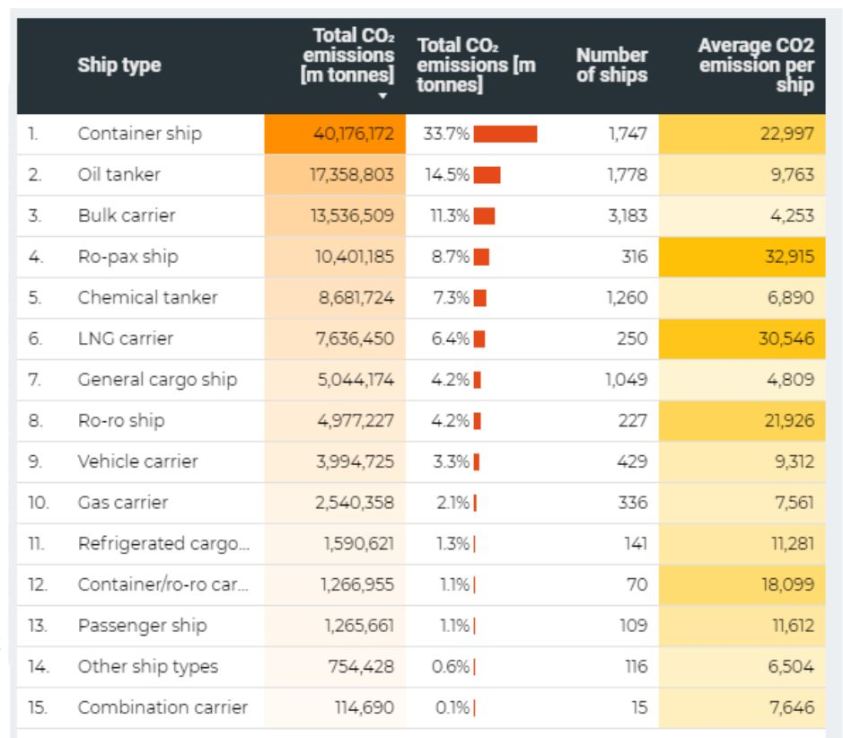
- Container ships (16% of all ships) account for around one-third of shipping’s CO2 emissions.
- Bulkers are the main ships category, which accounts for almost 30% of all ships while generating only 11,3% of shipping’s CO2 emissions.
- Even total emissions are almost equally distributed between intra-EU, incoming, and outgoing voyages, distribution depends on the ship’s type.
- The highest average emission levels are for ro-pax and LNG vessels.
Lets slides speak for themselves!
Access to slides can be found also here!