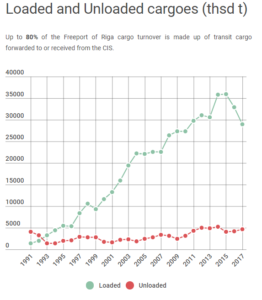
The Port of Riga is an important hub of freight transportation corridor that links goods’ production and consumption markets in the EU and the CIS countries. It…
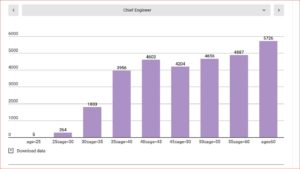
EMSA on 19.07.2018 published report on Seafarer Statistics in the EU ( www.emsa.europa.eu ). The statistical review presented in this report is based on data…
This blog was posted at World Economic Forum Agenda on the 11th of January 2016 as part of an essay contest on the Fourth Industrial…
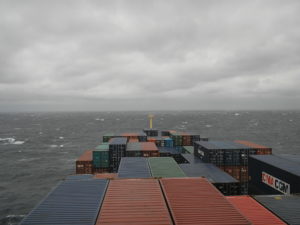
While there seems no end to the technological economies of scale in container shipping, the question is whether building ever bigger ships serves a purpose,…
The data in this graph reflects data from top 35 shipowning countries in 2017 (according UNCTAD secretariat calculations) as they represent 88% in terms of…

The future is unknown for us, however sometime development trends can be clearly seen. In this case autonomous ships timeline shows development path of autonomous…

Presented by Maurice Jansen at 20th International Conference MARITIME TRANSPORT AND INFRASTRUCTURE – 2018 (Riga, April 19-20, 2018) hosted by Latvian Maritime Academy.
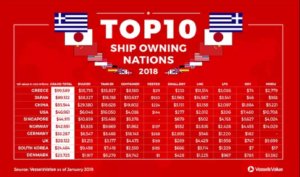
Updated figures regarding data from 2019 and 2020 can be found here: Fleet Value for Top 10 Shipowning Countries (2020) VesselsValue recently in january of…
Equasis world merchant fleet statistics report provides a picture of the world’s merchant fleet derived from data contained in the Equasis database. By using functionality…
Here is infographic reflecting growth of container vessels. Infographic republished from https://maritimecyprus.com.