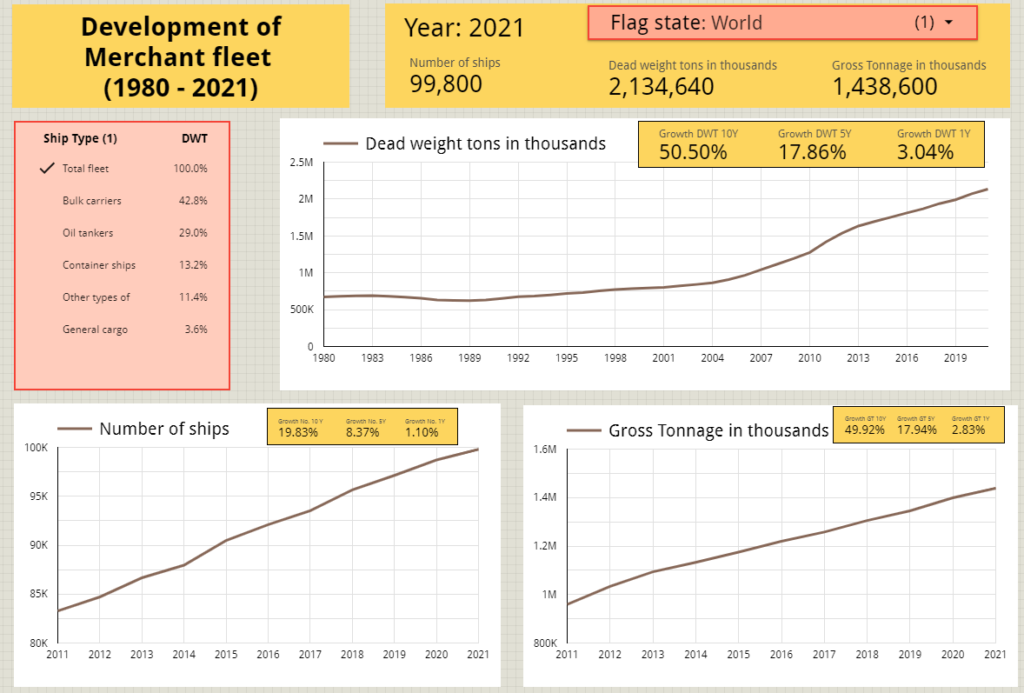
World’s merchant fleet can be analysed from different perspectives such as ownership, flag, growth in terms of DWT or number of ships, type of ships etc. etc. It is important for any visualisation of world’s merchant fleet development to give good overview of present situation and trends. Public data source which offers reliable data to follow world’s merchant fleet development is UNCTAD statics and data are available via their data center.
However it’s time consuming to go deep in data and understand the principles of how Unctad data center and tables are organized. Therefore this post offers a bit of help as the annual data regarding “Merchant fleet by flag of registration and by type of ship” and annual data regarding “Merchant fleet by country of beneficial ownership” are converted in four interactive dashboards and several graphs. Interactivity allows possibility to gain insight from a perspective of individual country with one or few clicks.
Analysis and visualization of beneficial owner countries with Google Data studio dashboards
Besides, by using those two buttons below, you can adjust the size of dashboards for them to fit better in your screen. Appropriately adjusted dashboard will allow a lot easier data exploring. Generally, the internet browser often needs a bit of time to load the dashboards. It depends on the internet connection and time required by the browser to make connection with the Google data studio.
Development of registered worlds’ fleet (ships > 100GT)
UNCTAD data regarding merchant fleet from perspective of flag of registry gives possibility to look on fleet development in terms of DWT and ship’s type already since 1980’s. Data regarding number of ships and fleet size in terms of GT available from year 2011. The UNCTAD figures cover seagoing propelled merchant ships of 100 gross tons and above, excluding inland waterway vessels, fishing vessels (from 2011 onwards only), military vessels, yachts, and offshore fixed and mobile platforms and barges (with the exception of FPSO – floating production, storage and offloading vessels – and drillships). Interactivity in first dashboard allows to click on highlighted fields (with red border) to change ships’ type or flag of registry and to follow fleet development trends. Interactivity in second dashboard allows to compare individual flag states (drop-down list allows to choose one or multiple flag states) with world data. The table view gives overview of main flag states and compare them with world’s merchant fleet data. It’s possible to add additional metrics (hover mouse over top-right area of table) regarding growth parameters or to remove parameters as well. Also it’s possible to choose other year and therefore access past data as well.
Development of registered fleet
Main flag states:
Who owns world’s fleet (ships > 1000 GT)
UNCTAD data regarding merchant fleet by country of beneficial ownership gives possibility to compare different shipowning nations. The vessels covered in table bellow include all propelled sea-going merchant vessels of 1000 gross tons (GT) and above, including offshore drill ships and Floating Production, Storage and Offloading units (FPSOs). Military vessels, yachts, waterway vessels, fishing vessels, and offshore fixed and mobile platforms and barges are excluded. Also there is possibility to add or remove additional metrics. The last dashboard allows analyse country’s owned fleet from perspective foreign or national flag as well as obtain data regarding 20 world’s biggest ships registries. Data refer to the beginning of a year indicated and are presented in thousands of deadweight tons (DWT) and in number of ships.
Beneficial ownership from individual country’s perspective
Other visualisations can be found here: http://infomaritime.eu/index.php/category/maritime-data/


Thank you very much
I will use these charts and data for my classes